Multithreaded Dumb HTTP Server
Overview
See Socket Multithreaded Dumb HTTP Server for the original description.
Requirements
This sample application negotiate IPv4 address from a DHCPv4 server running everywhere in your local network.
The 10/100 Ethernet MAC already configured in RMII/MII mode with MDIO using the
&macdevicetree label.
Building and Running
Build and flash Multithreaded Dumb HTTP Server as follows:
Build the Zephyr version of the sockets/dumb_http_server_mt application like this:
west build -b tiac_magpie -d build/dumb_http_server_mt-tiac_magpie zephyr/samples/net/sockets/dumb_http_server_mt -- -DCONFIG_NET_UDP=y -DCONFIG_NET_DHCPV4=y
west flash -d build/dumb_http_server_mt-tiac_magpie
Once DHCPv4 client address negotiation completed with server, details are shown on the console like this:
[00:00:00.271,000] <inf> net_config: Initializing network
[00:00:00.271,000] <inf> net_config: Waiting interface 1 (0x200212f8) to be up...
[00:00:00.762,000] <inf> net_config: Interface 1 (0x200212f8) coming up
[00:00:00.762,000] <inf> net_config: IPv4 address: 192.0.2.1
[00:00:00.762,000] <inf> net_config: Running dhcpv4 client...
[00:00:00.862,000] <inf> net_config: IPv6 address: 2001:db8::1
[00:00:00.862,000] <inf> net_config: IPv6 address: 2001:db8::1
[00:00:00.862,000] <inf> net_dumb_http_srv_mt_sample: Network connected
[00:00:00.862,000] <dbg> net_dumb_http_srv_mt_sample: process_tcp6: Waiting for IPv6 HTTP connections on port 8080, sock 0
[00:00:00.862,000] <dbg> net_dumb_http_srv_mt_sample: process_tcp4: Waiting for IPv4 HTTP connections on port 8080, sock 2
[00:00:00.863,000] <inf> net_config: IPv6 address: 2001:db8::1
[00:00:12.785,000] <inf> net_dhcpv4: Received: 192.168.10.199
[00:00:12.786,000] <inf> net_config: IPv4 address: 192.168.10.199
[00:00:12.786,000] <inf> net_config: Lease time: 36000 seconds
[00:00:12.786,000] <inf> net_config: Subnet: 255.255.255.0
[00:00:12.786,000] <inf> net_config: Router: 192.168.10.1
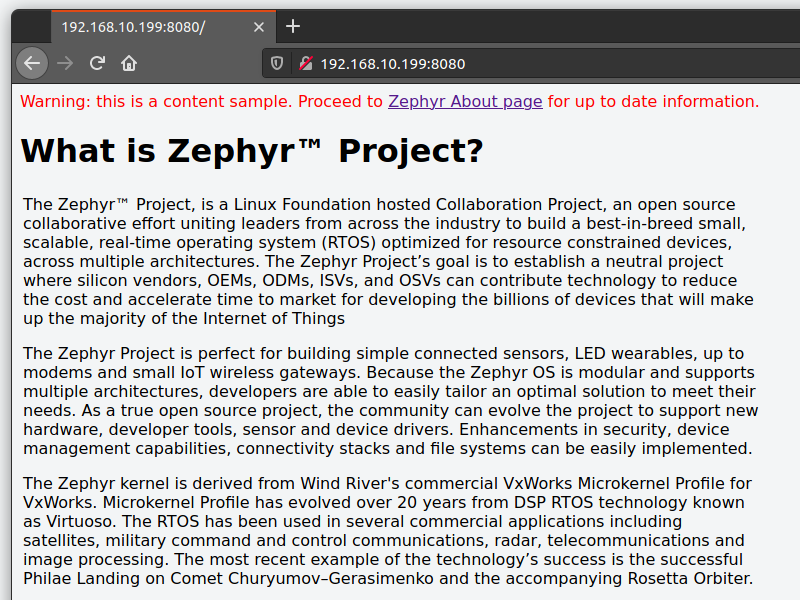
Now the sample was starting, it expects connections at 192.168.10.199, port 8080. The easiest way to connect is by opening a following URL in a web browser: http://192.168.10.199:8080/
You should see a page with a sample content about Zephyr (captured at a particular time from Zephyr’s web site, note that it may differ from the content on the live Zephyr site).
Alternatively, a tool like curl can be used:
$ curl http://192.168.10.199:8080/
Finally, you can run an HTTP profiling/load tool like Apache Bench
(ab) against the server:
$ ab -g dumb_http_server_mt_ab.csv -n 100 -c 50 \
     http://192.168.10.199:8080/ | tee dumb_http_server_mt_ab.log
$ gnuplot dumb_http_server_mt_ab.p
The -n parameter specifies the number of HTTP requests to issue against
a server. The -c parameter specifies the number of multiple requests to
perform at a time. An example result would looks like:
This is ApacheBench, Version 2.3 <$Revision: 1843412 $>
Copyright 1996 Adam Twiss, Zeus Technology Ltd, http://www.zeustech.net/
Licensed to The Apache Software Foundation, http://www.apache.org/

Benchmarking 192.168.10.199 (be patient).....done


Server Software:
Server Hostname:        192.168.10.199
Server Port:            8080

Document Path:          /
Document Length:        2084 bytes

Concurrency Level:      50
Time taken for tests:   0.215 seconds
Complete requests:      100
Failed requests:        13
   (Connect: 0, Receive: 0, Length: 13, Exceptions: 0)
Total transferred:      186180 bytes
HTML transferred:       181308 bytes
Requests per second:    465.45 [#/sec] (mean)
Time per request:       107.424 [ms] (mean)
Time per request:       2.148 [ms] (mean, across all concurrent requests)
Transfer rate:          846.26 [Kbytes/sec] received

Connection Times (ms)
              min  mean[+/-sd] median   max
Connect:        0    2   0.3      2       3
Processing:     2   23  57.5      5     209
Waiting:        0    9  34.8      3     209
Total:          4   24  57.7      6     212

Percentage of the requests served within a certain time (ms)
  50%      6
  66%      6
  75%      6
  80%      6
  90%      9
  95%    206
  98%    209
  99%    212
 100%    212 (longest request)
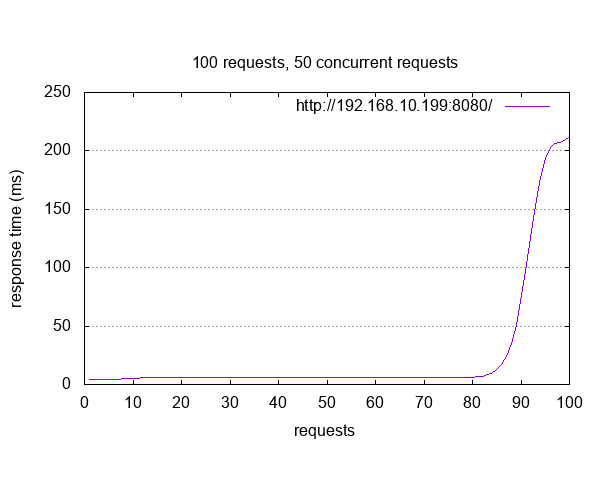
GNUplot script:
set terminal png size 600
set output "dumb_http_server_mt_ab.png"
set title "100 requests, 50 concurrent requests"
set size ratio 0.6
set grid y
set xlabel "requests"
set ylabel "response time (ms)"
plot "dumb_http_server_mt_ab.csv" using 9 smooth sbezier with lines title "http://192.168.10.199:8080/"